Organization Analytics
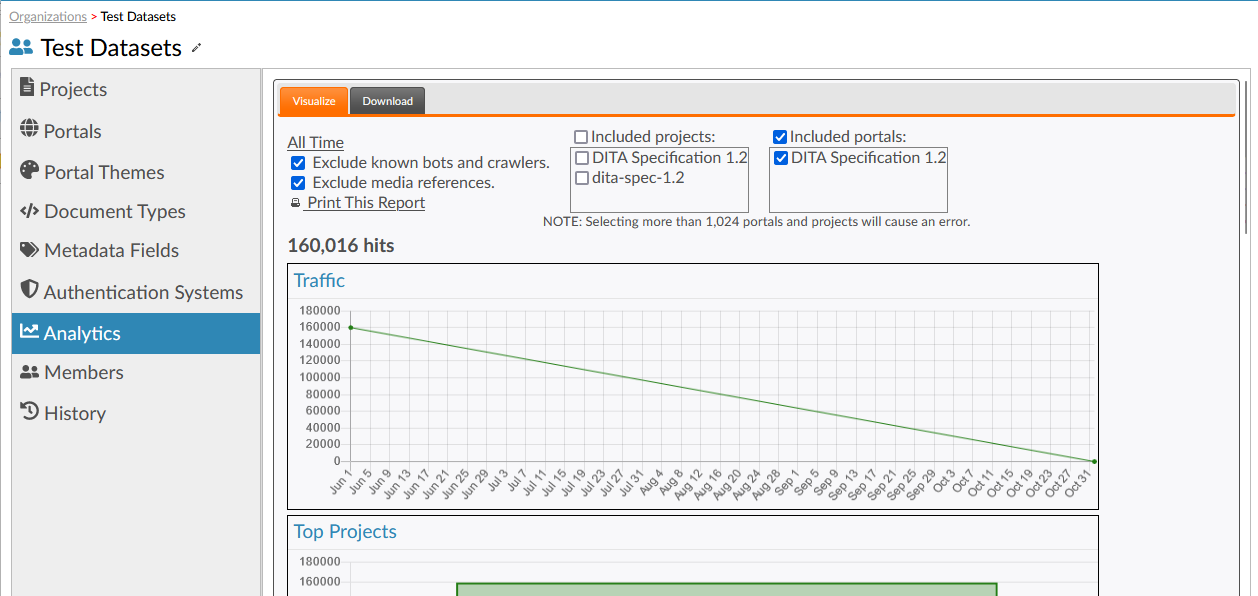
Click the time range at the top of the screen to select an alternative time window from which to generate the report charts. You can also exclude traffic from known bots and search engine crawlers by selecting the Exclude known bots and crawlers checkbox. Finally, use the Exclude media references checkbox to configure whether references to non-content objects, like graphics, should be excluded from the reports.
By default, all portals owned by the organization are included. This will usually provide all desired information, because it will include projects attached to all portals. Add projects under Included projects to include them in the visualization. Uncheck portals under Included portals to exclude them from the visualization.
There is a built-in limit that prevents more than 1,024 portals and projects from being selected at once. The query will not run if more than 1,024 portals and projects are selected. In some cases this will cause an error.
Organization analytics include the following reports:
- Traffic
- Traffic over the selected time period.
- Top Projects
- The top 10 projects owned by the organization, in terms of traffic received.
- Top Portals
- The portals sending the most traffic to the projects.
- Most Viewed Files
- The top 10 most-viewed files.
- Most Viewed DITA Map Contexts
- The top 10 DITA maps whose topics and/or tables of contents have received the most views over the specified time range across all portals.
- Most Up-Voted
- The 10 topics with the most 'Yes' votes in the Was This Useful? box.
- Must Down-Voted
- The 10 topics with the most 'No' votes in the Was This Useful? box.
- Top Browsers
- The top browser family names, as determined from the browser's
User-Agentrequest header value.Note: Modern Microsoft Edge™ browsers (released in late 2019) were recorded as "Chrome" browsers in Titania versions prior to 4.3. - Top Countries
- The 10 most-common countries from which traffic is generated, where the client's geographical region can be determined.
- Top Regions
- The 10 most-common regions (e.g. states or provinces) from which traffic is generated, where the client's geographical region can be determined.
- Top Cities
- The 10 most-common cities from which traffic is generated, where the client's geographical region can be determined.
- Top Browser Locales
- The 10 most-common browser locales.
- Top Referrer Domains
- The 10 most-popular referring web domains.
Downloading Reports
The pie charts only show the top ten results for any given metric. Titania Delivery allows the downloading of all statistics in a convenient CSV format.
Select the Download tab on the Metrics section of the portal administration area.
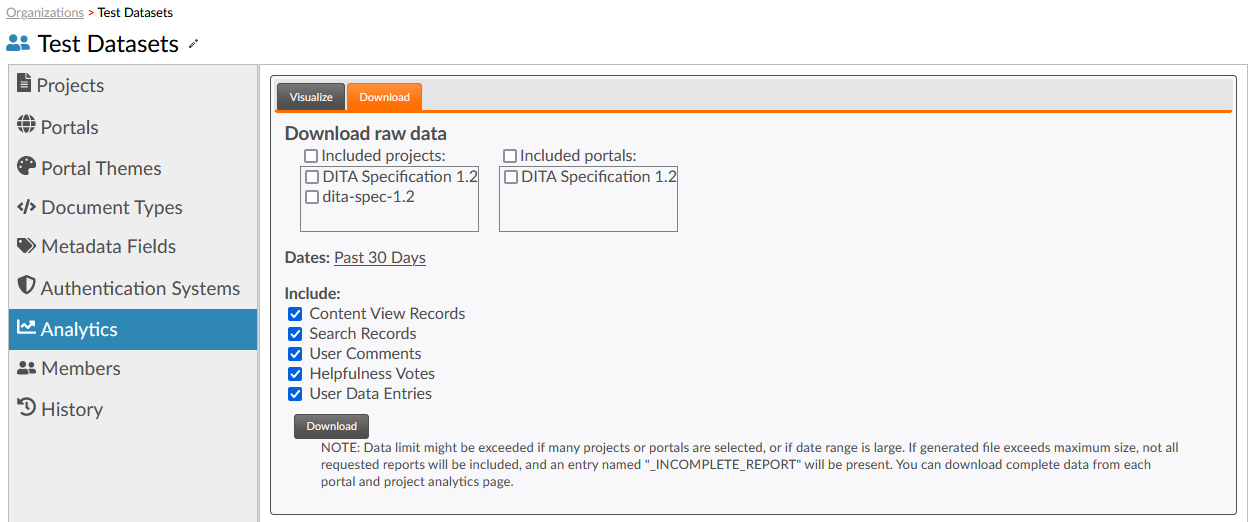
Specify the date range and reports you wish to download. Click the Download button to recieve a ZIP archive containing CSV files for each report.
By default, no projects or portals are selected. Because the amount of usage data for an entire organization can exceed system capacity, you should limit requests to specific portals or projects needed, and limited date ranges. Regardless of input selections, if the data exceeds the maximum, the file size will be limited, and an additional file entry named "_INCOMPLETE_REPORT" will appear in the zip file. You will usually be able to download complete usage data from individual project or portal analytics pages.
- Content View Records
- Every view of a piece of content through a portal will be
recorded in this report, including a timestamp, identifying
information for the user, as well as details of their
browser, operating system, and device.
Note: The modern Microsoft Edge™ browser name is recorded as "Chrome" prior to Titania version 4.3. Starting with version 4.3, the name of these browsers is recorded as "Edge", and the "User Agent" string will have been modified from its original form to change the spelling of "Edg" to "Edge". You should take this change into account when performing further analysis on the "User Agent" values. If it is necessary to distinguish between Edge™ versions, use the version identifier.
- Search Records
- Every search attempted via the portal will be recorded, including search term, the number of results, and whether the user needed to navigate past the first page of results.
- User Comments
- This report contains element and document-level comments in the portal, including identifying information for the document and, when applicable, the element where the comment was left.
- Helpfulness Votes
- This report includes the responses, including comments, left through the Was This Helpful widget that appears on many portal web pages.
- User Data Entries
- This will cause the zip to include a
userdatafolder, containing the data stored using the Portal Theme SDK'sUserDataandSiteDatafeatures. Each user withUserDataentries will have its own XML document containing that user's data. In addition, there will be asite.xmlfile containing anySiteData.