Project and File Analytics
Once your content is visible through at least one portal, you can use the
Analytics and Feedback views to analyze traffic
patterns to your content.
Analytics
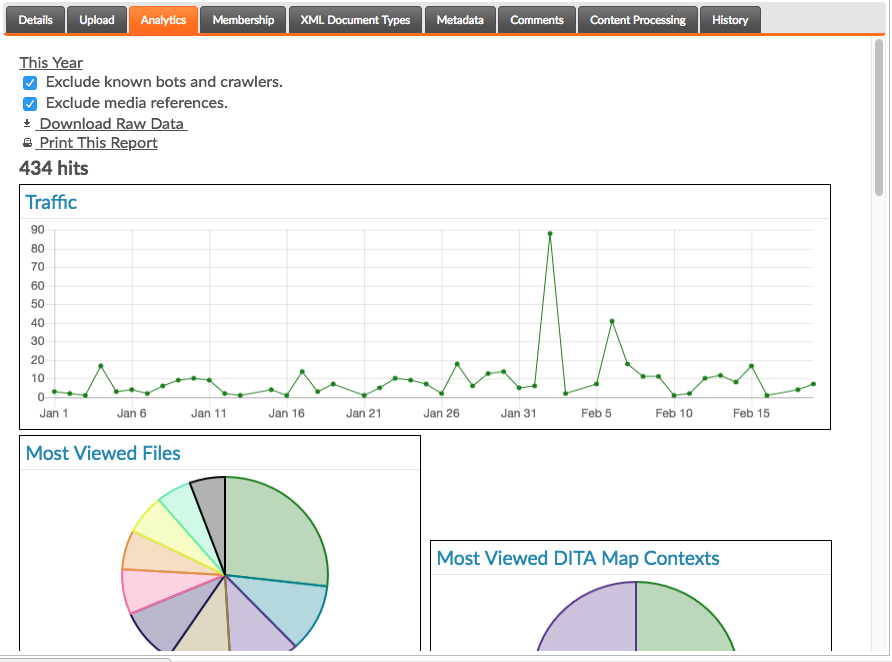
Additionally, you can download a CSV export of the raw data behind the charts, bound by the selected date range, using the Download Raw Data link. Finally, click the Print This Report button, or use your browser's Print function, to print the report.
Project Charts
The charts on for projects include the following.
File Charts
The charts on for individual files include the following.
- Most Viewed Topics (DITA Maps Only)
- If the file is a DITA map, this report appears, displaying the topics within the map receiving the most traffic over the selected time period.
- Most Viewed Map Contexts (DITA Topics Only)
- If the file is a DITA topic, this report appears, displaying the map contexts through which this file recieves the most traffic.
Note:
Feedback on Files
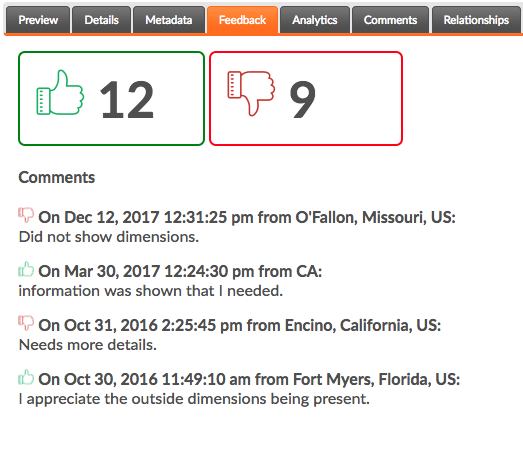
The Feedback tab on files can be used to review the various upvotes and downvotes that have been left for that file through all portals, and any comments the users have left when making those votes.