1 Advanced Administration Features
- System Monitors
- Members of the System Monitors organization will see a Monitors link in toolbar, allowing them to monitor content processing activity across the system.
- Security Administrators
- Members of this organization will see a User Management button on the homepage, allowing them to manage the admin application's users.
- System Administrators
- Members of this organization have the ability to see and modify the built-in default portal themes and document types.
The root user is the owner of all three organizations. (The root user is created by the system administrator who initially sets up a Titania Delivery site.) The ownership of these organizations cannot be changed, because they have a special, protected status to prevent inadvertent deletion or modification. However, other admin users should be granted Administrator role in these organizations, which will allow them to carry out all TD administrative duties (except deleting the organization or changing ownership). Other users may be added in the Member role, which will grant them the privileges that come with membership in each special organization.
1.1 System Monitors
Content Engine Status
The Content Engine Status link in the header of the Administration interface will take users to the Work Queue view.

This view has three main sections.
- The Work Queue chart shows the current size of the work queue, and the activity over the last 5, 10, 30, or 60 minutes.
- Below the graph, the overall work queue size is displayed, and the number of each
type
of event sitting in the queue.
Note: If the queue length is a negative number when there is no processing occurring, refer to clearQueue() for a procedure to reset the resting queue size to 0.
- The Content Engine Processors area lists the content processing threads available to the system, and their current activity, if any.
Common Event Types
There are many different types of events that can be added to the work queue. Here are some of the most common.
- ITEM_PROCESSING_REQUESTED
- When a file is uploaded or reprocessed, this type of event is added to the queue.
These appear as orange in the chart.
Note: These types of events are prioritized based on the file extensions being processed. Files ending in
.ditaare processed first; files with.ditamapare processed last; and all other files happen in between those two.This is the reason for the shape of the graph seen above. The topics, which process quickly, are processed first, so the graph rapidly drops. Then the ditamaps are processed. Those take longer, and so the chart flattens out.
- CONTEXTUALIZATION_CREATED
- When the content engine processes a DITA map, it creates contextualized copies of all of the referenced topics. The creation of these copies triggers some downstream processing that is put on the work queue rather than being part of the map processing itself. These appear as light orange-yellow on the chart.
- ITEM_CREATED and ITEM_UPDATED
- When files are uploaded, ITEM_CREATED (for new files) or ITEM_UPDATED (for existing files) events are placed on the queue. The processing of these events involves preparing the items for their processing, which is subsequently initiated by ITEM_PROCESSING_REQUESTED events.
- BATCH_UPDATE
- When a project or folder is reprocessed, a single BATCH_UPDATE event is placed on the queue. The processing of this events prepares all of the affected files for processing, then issues ITEM_PROCESSING_REQUESTED events for those files.
1.2 Security Administrators
The User Management view lists all the Titania Delivery administrative application users, their e-mail addresses, and the last time they logged into the system.

From this view, users can create new users, delete existing users, and lock or unlock specific accounts. Users can also update a user's password in the event that their password is lost or forgotten.

The action drop-down is hidden for the root user and for the currently logged-in user. The currently logged-in user can update their password and other settings using the Account button.
Selecting the Delete User action item will display the following
dialog.
Clicking the Add User (+) button brings up the Add User dialog, allowing you to specify the new user's details.

1.3 System Administrators
When a new Titania Delivery instance is first created, the default document types and portal themes are installed, owned by the root user. The System Administrators organization is added to these assets as an administrator, so its members can manage them.
System Administrators also have a number of additional system monitoring and administration capabilities.
1.3.1 Monitoring the JVM

1.3.2 Java Management Extension (JMX) Interface

Titania Delivery provides three Management Beans, or MBeans.
- ContentEngineInspector
- This bean can be used to inspect the current status of the Content Engine, if it is
included in the Web tier. (If using a standalone Content Engine, this bean appears
on the
Content Engine's embedded Web console, and will not have any data here.)
- ActiveEvents
- The JSON presentation of the events work currently being done.
- ActiveNotifications
- The notifications being dealt with at the current time.
- EventCount
- The total number of events handled since the system started up.
- EventsByType
- A JSON object containing the number of events of each type handled by Content Engine since it started up.
- NotificationCount
- The total number of notifications handled by the system since it started up.
- NotificationsByType
- A JSON object containing the number of notifications of each type handled by the system since it started up.
- PortalRenderingInspector
- Displays information about the active XSLT transformations currently being processed
by
the system for Portal display. This can be used to track down potential "hanging"
XSLT
stylesheets that can cause the system to lock up.
- ActiveRenders
- The currently-running renderings.
- RenderCount
- The number of XSLT renderings that have been performed since system start-up.
- QueueInspector
- Displays information about the contents of the work queue.
- ClaimedEventsByClaimant
- Displays the events claimed by each Content Engine thread.
- EventProcessors
- The list of IDs of all Content Engine worker threads.
- QueueSize
- The number of events currently on the work queue.
- QueueSizeByType
- A JSON object dscribing the number of events of each type currently in the queue.
- clearQueue()
- This action will clear the contents of the work queue.
Warning: Use this with extreme caution. It effectively cancels all scheduled future processing.Note: If the queue count appears as a negative number,
clearQueue()will not reset it to zero. The workaround is to launch a content processing job that will populate the queue for a minute or so (for example, by reprocessing all files in a project). While the queue size is greater than zero, click on the execute button under theclearQueue()operation. Verify the queue size is 0, then re-launch the content processing job to ensure that files are correctly reprocessed.
There are additional management bean categories available through this interface. The following are management beans that may be of particular interest to Titania Delivery administrators:
- java.lang
- Contains management beans for the JVM itself. Of these, the Memory bean has an action called gc() that can be used to cause the JVM to initiate garbage collection.
- net.sf.ehcache
- This category contains beans that can be used to monitor the status of the various in-memory caches used by Titania Delivery.
1.3.3 Managing robots.txt
robots.txt file for the Titania Delivery system as a whole. While each
portal can specify whether its path is included with an Allow or
Disallow rule, System Administrators can manually author the first part of
the dynamically-generated robots.txt file.To edit robots.txt, simply select the robots.txt
link in the header.
This link will open the Manage robots.txt page. The top of this page
is a simple text editor with save, revert, undo, and redo actions. Users can enter
the data
for the robots.txt content using this editor.
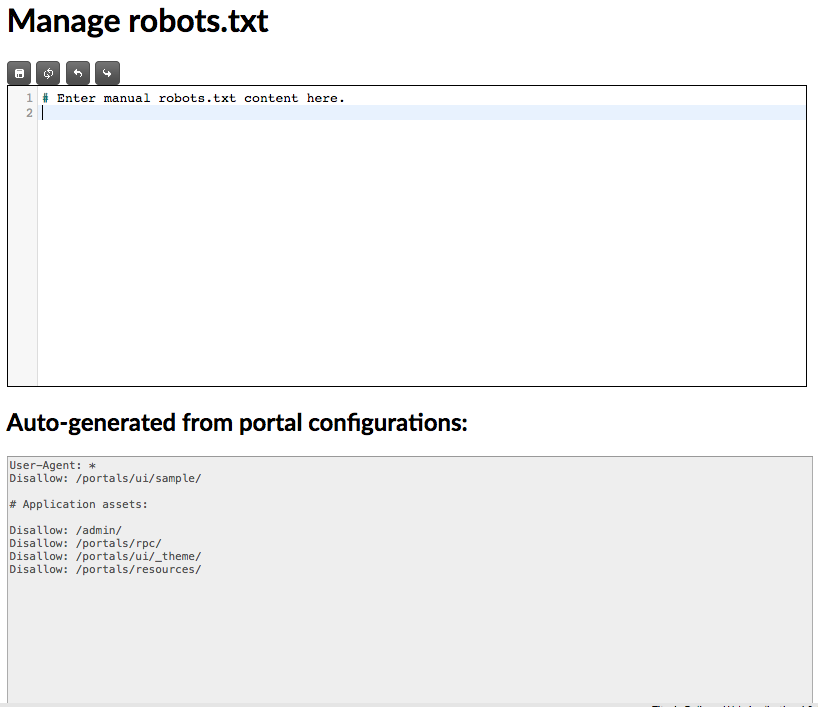
The bottom part of the screen displays the automatically-generated code based on the various portals' configuration settings.
1.3.4 Default System Configurations
Metadata Field Configuration
The Metadata Field Configuration for the System Administrators organization will automatically be copied to all new Organizations created in the system. Modifications to the field configuration will be used for all new organizations made in the future. This allows administrators to set up the default metadata schema for new groups and organizations in the system without having to copy the configuration to multiple organizations manually. See Metadata Field Configuration for details.
Portal Authentication Systems
The LDAP, SAML 2.0, and OpenID Connect authentication configurations in the System Administrators organization will be available to all portals in all organizations in the system. This reduces the need to copy security configuration information to multiple organizations that share identity providers. See Portal Security Configuration for details.
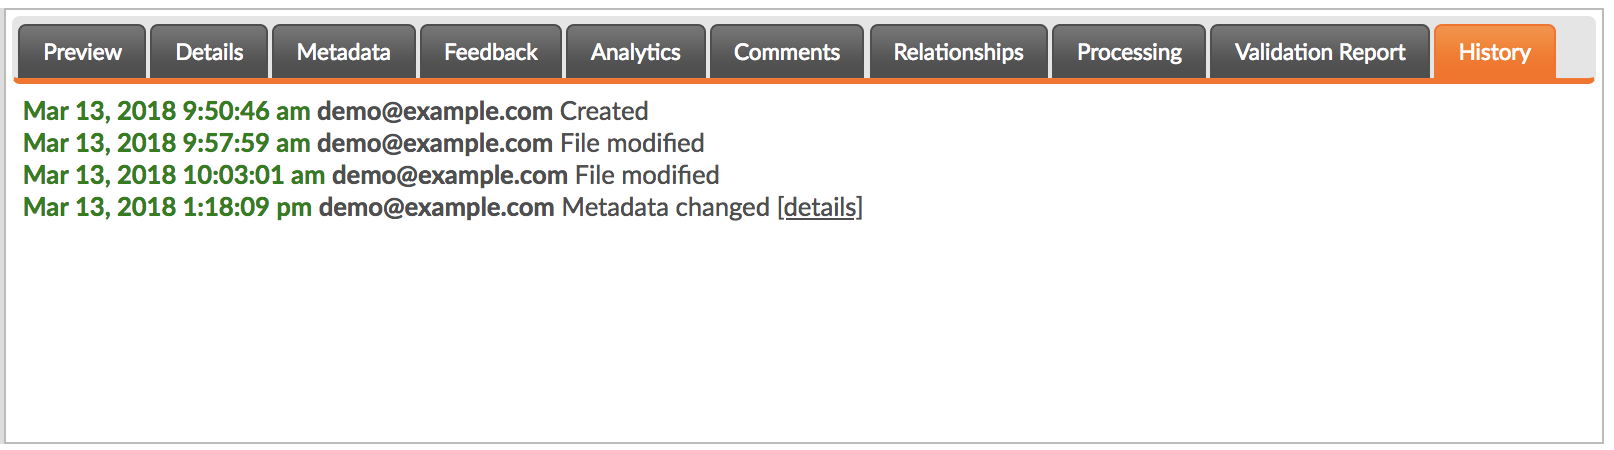
1.4 Auditing Administrative Actions
An object's audit log includes individual entries representing some change to the object in question, including a time stamp, the administrative username of the user who performed the action, and a brief description of the action.
Some audit log entries also carry additional details accessible by clicking the details link. For example, records pertaining to changes to a file's metadata include details of exactly which properties were modified, as well as their old and new values.
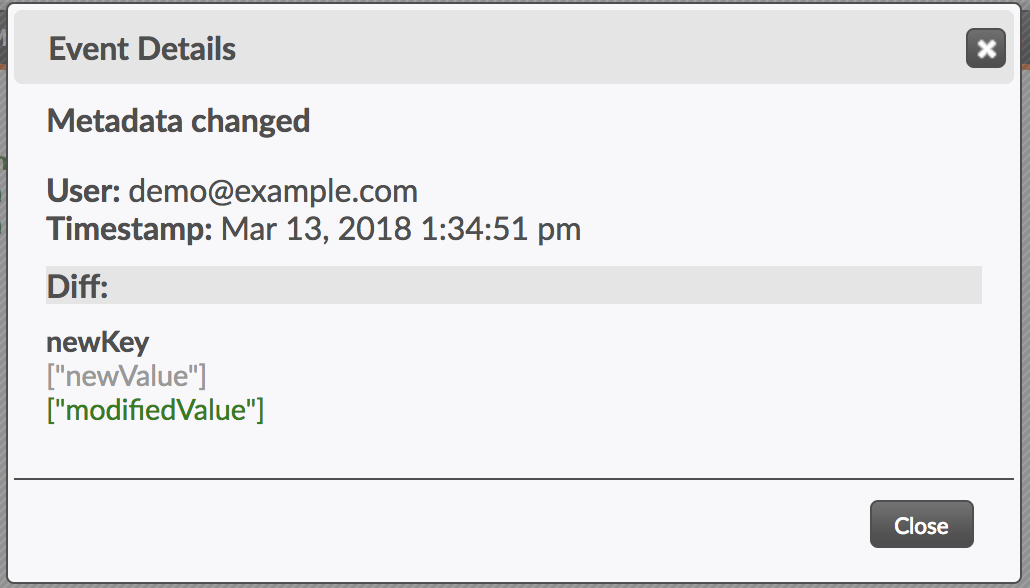
In this example, the metadata newKey changed from "newValue" to "modifiedValue."